Writing functions
From wondering to needing to empowering
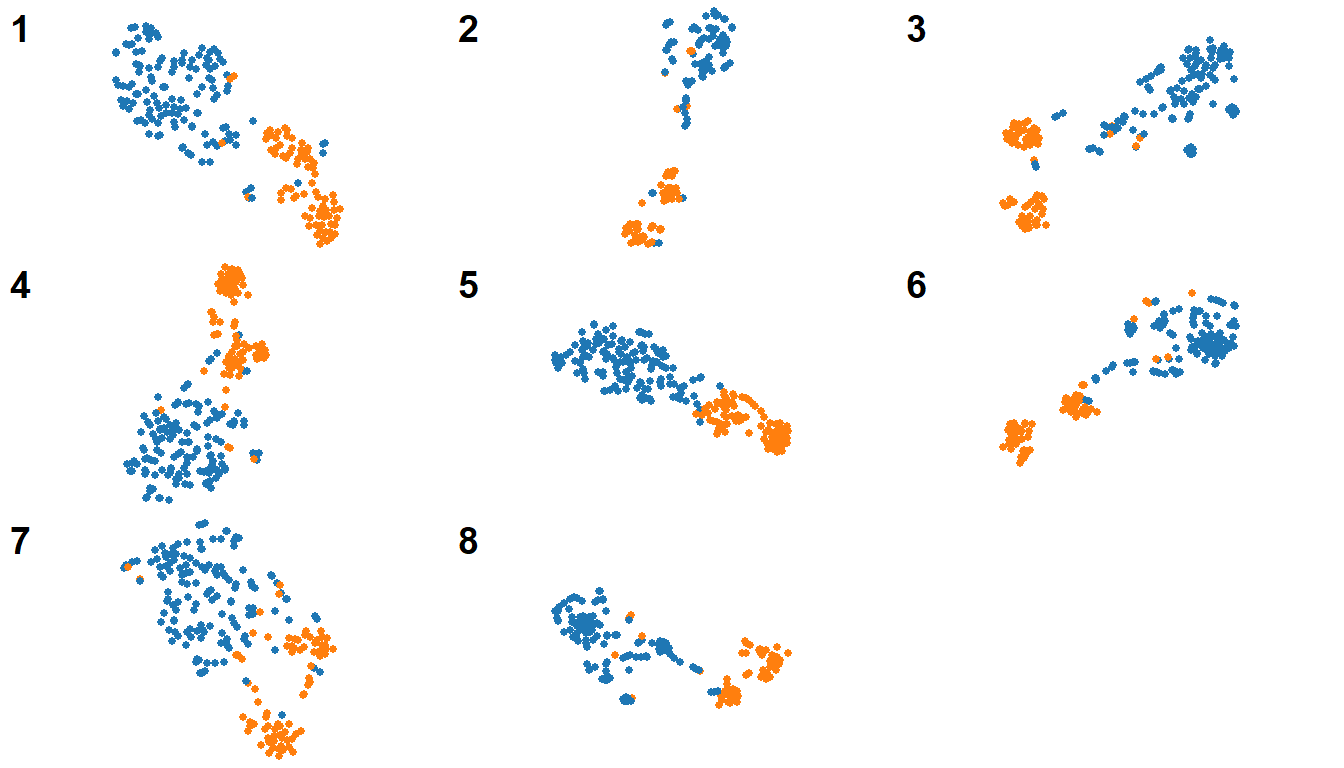
 Various plots created with the same function
Introductory courses of a programming language will teach you how to create functions. What takes longer to learn is what for. As a data analyst you can get around perfectly fine without ever writing a function —you just chain and combine functions that are already there. I still remember my confused feelings when reading Levshina’s amazing book on R for linguistics. She walks you through useful packages and functions adequate for each task, but now and then she would give the raw code of a function and I would go: “Why?”. If you know already that I will need it, why isn’t it in a package? Why do I have to write it?
(I also felt weird copying raw code that someone put out there like that. It wasn’t mine. Is this ok? How do I acknowledge that? That’s another issue.)
While I still remember those first feelings, I have gone a long way since then. I’ve written functions in multiple scripts and drowned in their endless chains. I’ve messed up so much with their scope and assumptions and hard-coded values that I’m much wiser from it. I’ve written two R packages of my own (one forever private). I’ve created function factories and functions that take functions as arguments (!!). But each step was only possible when I could understand WHAT FOR. When it rose from my own need.
It might be the case that you are on a similar path, who knows in what stage. I write this in the hope that this will give you a peek of what is around the corner.
How I write functions and why
My main reason for writing functions is to avoid repetition: instead of copy-pasting that chain of code I’m applying to different situations, I write one version as a function and call it every time I need it. So… yes, laziness pushed me to writing functions. Not the copy-pasting itself, but every time I needed to fix or adjust something in that copy-pasted code, I had to trace where else I was using it to adjust it every time. It takes time and you mess up and it’s boring. Now I have a stronger tendency to turn every repeated and connected value to a variable, and every repeated snippet of code into a function. This is also related to a sustainability mindset: going from a notion of my code as something ephemeral, a one-shot solution to an immediate problem, to thinking ahead in terms of recurrent needs, reusable code, lasting usefulness.
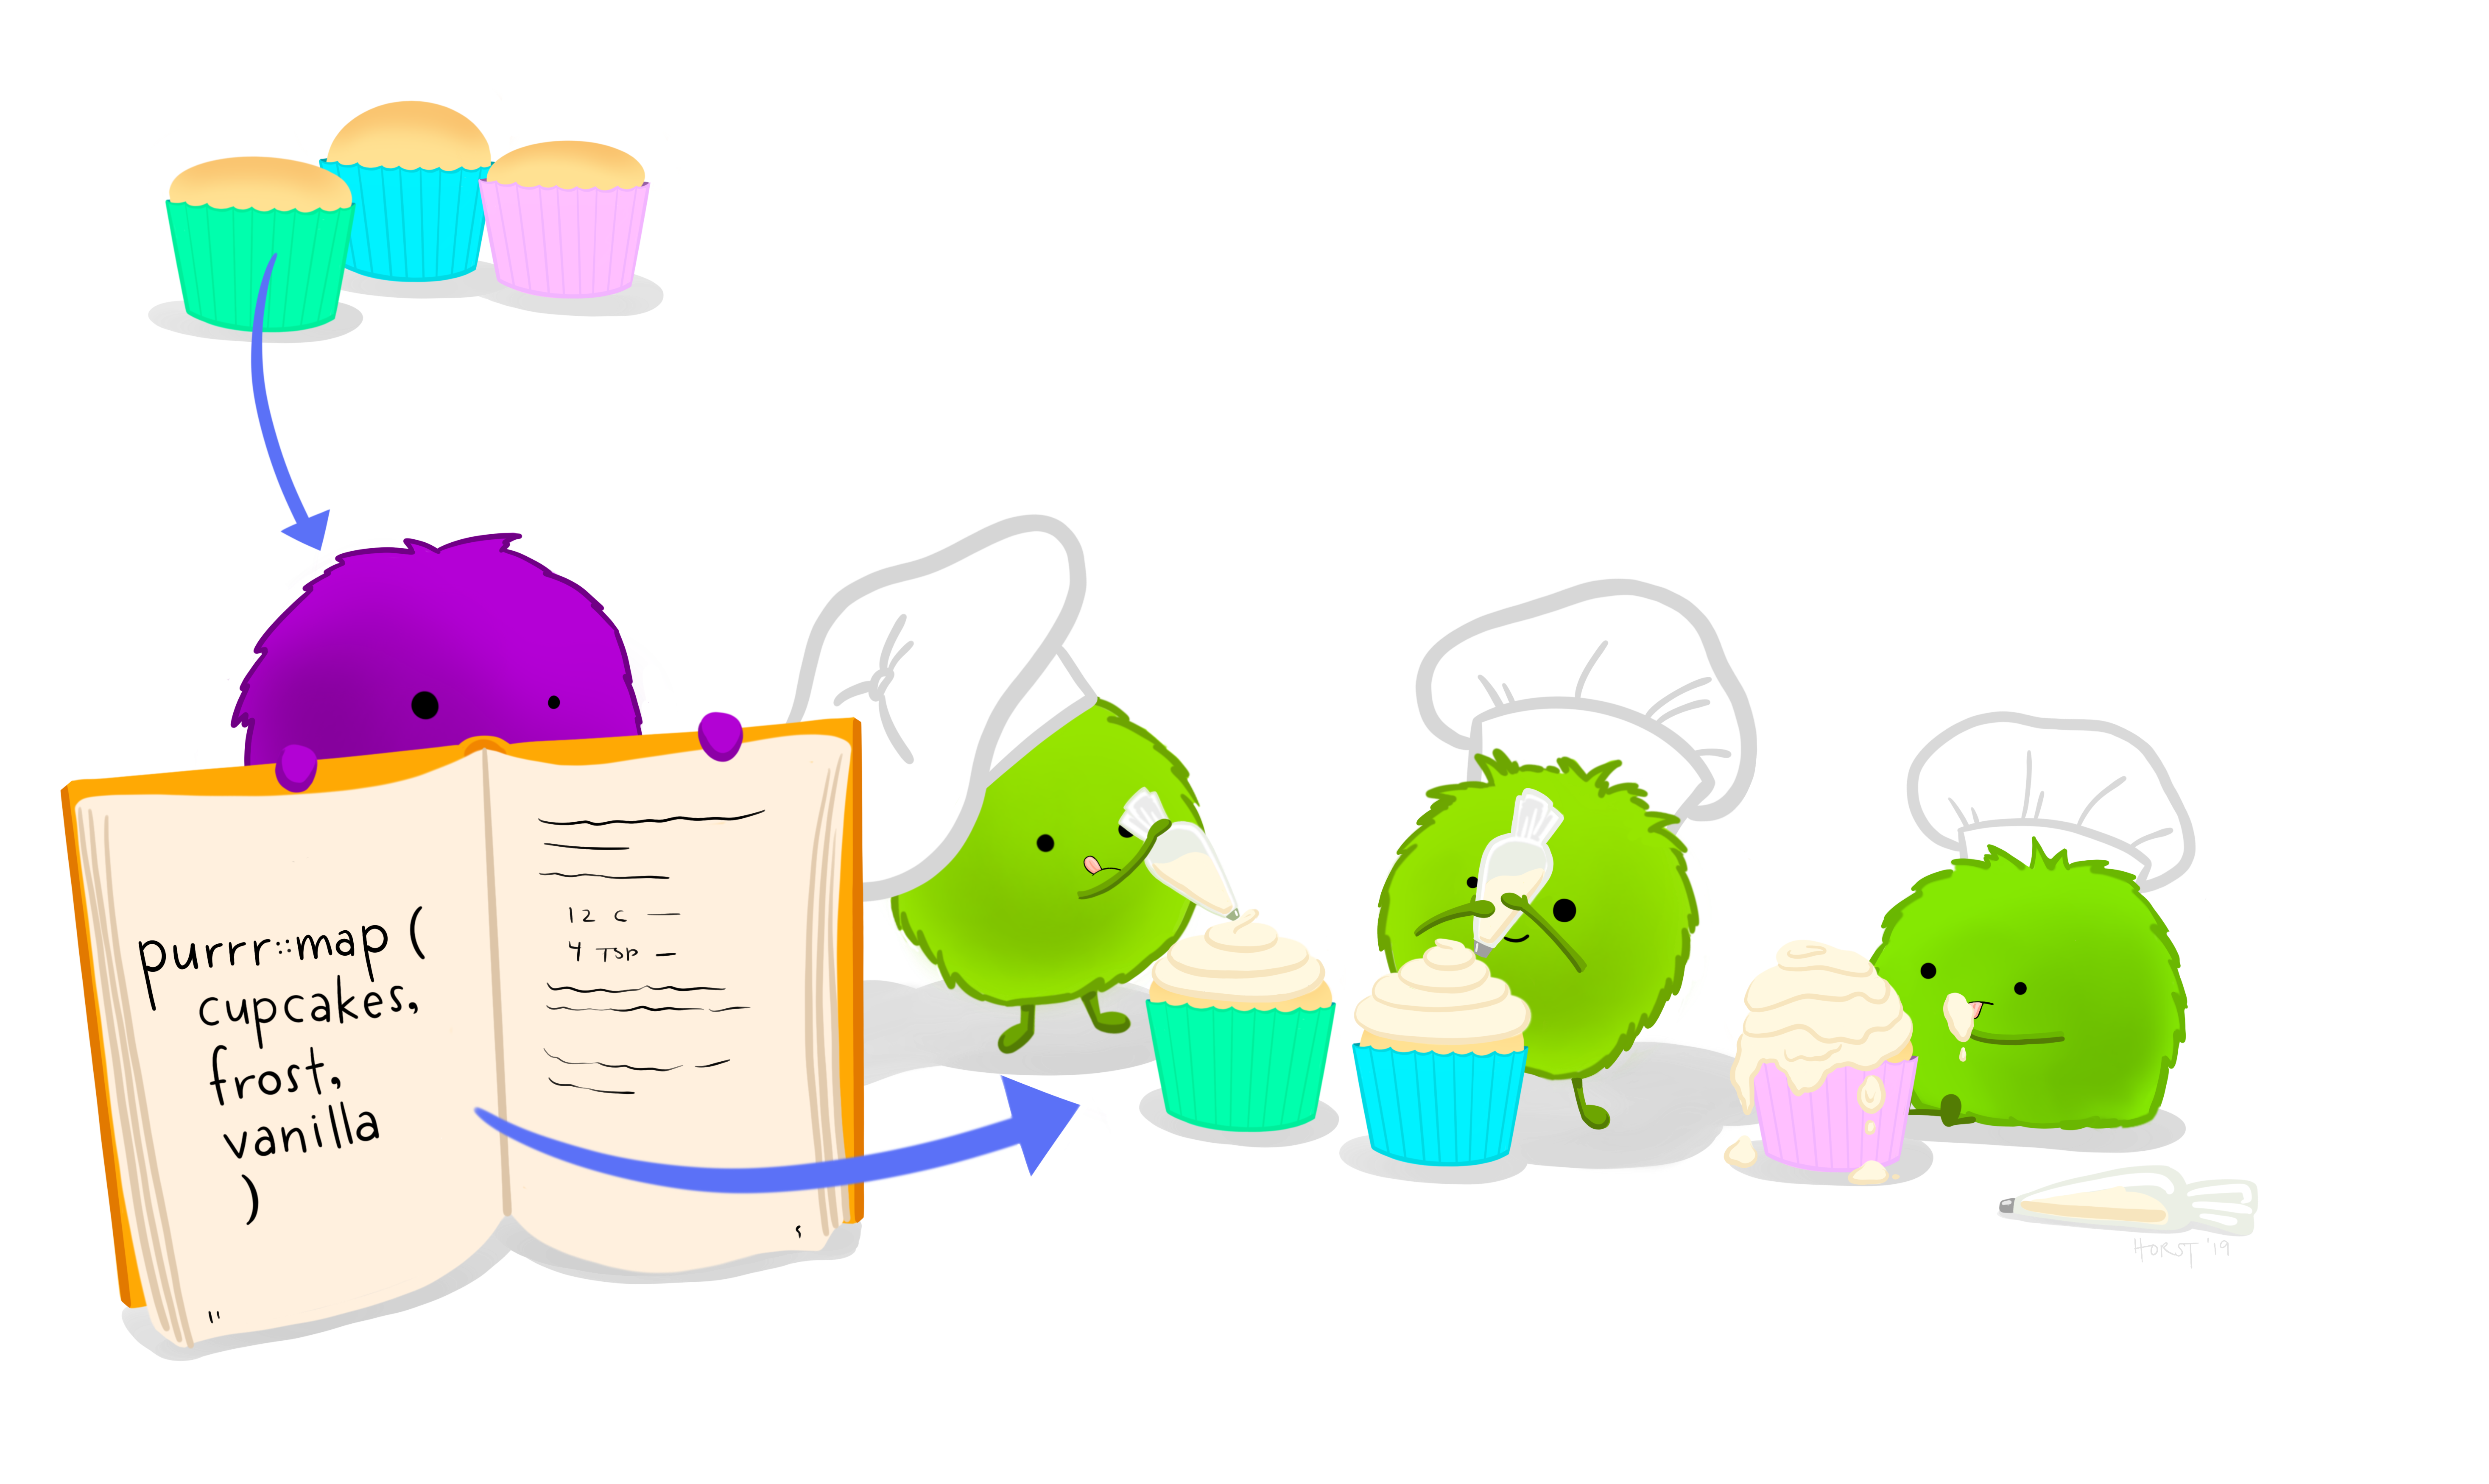
In The joy of programming, Hadley Wickham also emphasizes how writing functions can help you distinguish between the parts of the procedure that are repeated and those that are different on every run. He exemplifies with cupcakes: many cupcake recipes are almost identical to each other, except for some substitution to change the flavour (flour with cocoa for chocolate cupcakes, milk with espresso for espresso cupcakes…). By knowing what stays the same and what is modified, you can be more efficient and flexible.
Next to these ideas, functions go well with the programming style I’m moving towards. I was given the advice not to write functions that spanned longer than the size of my screen, which is surprisingly hard to achieve for me. But it’s a good tip! It makes them more readable and manageable, which is useful for debugging. You can always split your functions into more, shorter functions, which can then be tested in isolation or even combined with other future functions. I used to think this was not necessary at all, but the more I program the more I get used to the fact that there will be bugs, I will have to fix things, so I have to write as clear and atomic as possible, for the mental health of future me.
Practical function-creating workflow
So, how do you get about writing a function? Do you sit in front of your blank page and gaze at the universe for inspiration? Where do you start? The basic template1 for a function is the following:
functionName <- function(formals) {
    body
}
A function doesn’t really need a name, but I made the argument that you can use functions to avoid repetition, and then you do need a name. Let’s talk about that situation.
I do not start with the empty template of a function, but with the content. As an example, I will show some code I’ve used and written and rewritten many times in my dissertation, which creates a scatterplot with a certain style. As a background: most of my thesis was about visualization, in particular scatterplots where each dot is an occurrence of a word, and dots that are together are occurrences with similar contexts. For example, the plots of Dutch heffen ‘to lift/to levy’ tend to have groups of tokens co-occurring with belasting ‘tax’ (‘to levy taxes’), with glas ‘glass’ (‘to lift a glass, to toast’) and with body parts (e.g. de handen ten hemel heffen ‘to lift the hands to the heavens’).
My main dataset is a table with coordinates and other variables:
mydf## # A tibble: 207 x 8
## `_id` model.x model.y cws cluster membprob eps sense
## <chr> <dbl> <dbl> <list> <fct> <dbl> <dbl> <chr>
## 1 hef/verb/nrc_handelsblad~ 18.6 -20.7 <chr ~ 4 0.307 1.91 lift
## 2 hef/verb/volkskrant_2000~ 4.82 -11.2 <chr ~ 0 0 3.71 levy
## 3 hef/verb/parool_20020720~ 12.0 -11.2 <chr ~ 0 0 3.01 lift
## 4 hef/verb/algemeen_dagbla~ -17.2 14.8 <chr ~ 0 0 3.09 levy
## 5 hef/verb/algemeen_dagbla~ 10.5 -5.27 <chr ~ 0 0 2.77 lift
## 6 hef/verb/de_morgen_20041~ -4.96 5.87 <chr ~ 0 0 3.20 levy
## 7 hef/verb/de_standaard_20~ 15.9 -10.2 <chr ~ 0 0 3.45 lift
## 8 hef/verb/het_laatste_nie~ 0.480 9.27 <chr ~ 2 0.0847 2.45 levy
## 9 hef/verb/nrc_handelsblad~ -16.6 7.69 <chr ~ 0 0 2.88 levy
## 10 hef/verb/volkskrant_2001~ -13.4 16.7 <chr ~ 0 0 2.80 levy
## # ... with 197 more rowsThe columns model.x and model.y represent the x and y coordinates, and the sense column contains manual sense annotation (a categorical variable). I want to plot the coordinates and color the dots by their sense.
mydf %>% ggplot() +
  geom_point(aes(x = model.x, y = model.y, color = sense), size = 3)
The coordinates for the scatterplot were generated with t-SNE: the axes don’t mean anything, but the length of a unit on the horizontal axis should be the same as in the vertical axis. I also think that a square plot might be neater, so the range of values on both axes should be the same. For this purpose I have to remove the axis and grids (ggplot2::theme_void()), fix the coordinates (ggplot2::coord_fixed()) and establish the ranges (ggplot2::xlim() and ggplot2::ylim()). I also want to set a nicer color palette such as ggsci::scale_color_d3().2
# identify the possible coord values
myvalues <- c(mydf$model.x, mydf$model.y)
# compute minimum and maximum coord values
myrange <- c(min(myvalues), max(myvalues))
mydf %>% ggplot() +
  geom_point(
    aes(x = model.x, y = model.y, color = sense),
    size = 3) +
   # set range of axes
  xlim(myrange) + ylim(myrange) +
   # hide axes and grids
  theme_void() +
   # same unit for both axes
  coord_fixed() +
  # colour palette
  ggsci::scale_color_d3()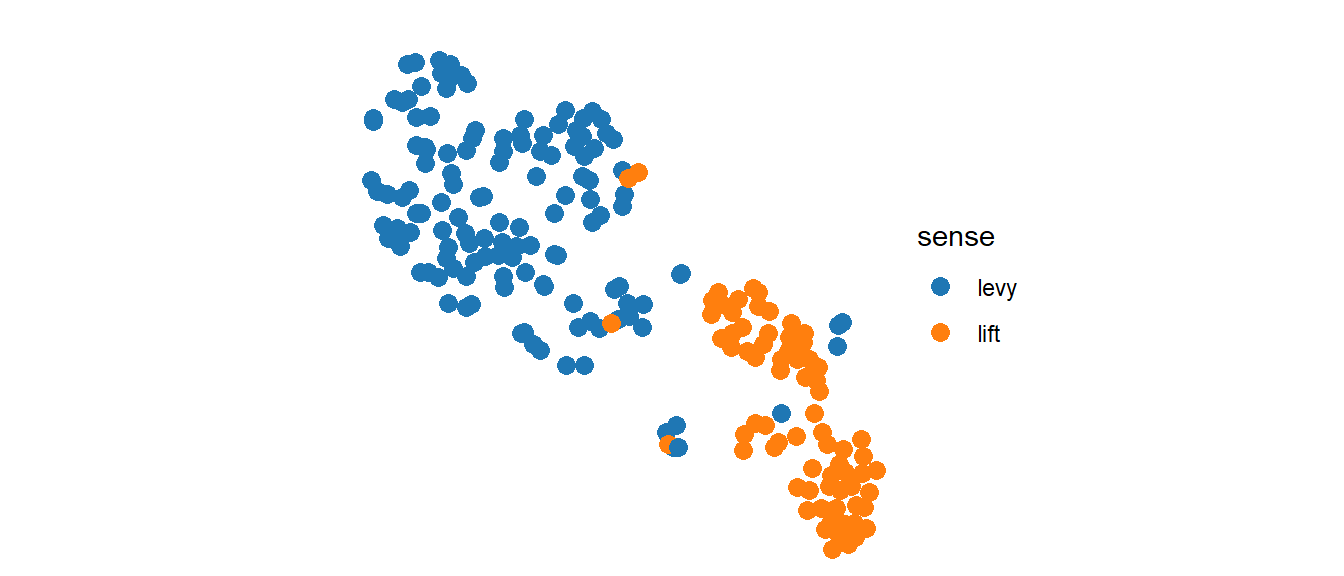
The code is already much more complex! It would be fine if it was a one-shot occasion, but I will use this code a lot: because I have many words to analyze, but also because I have many plots per word. The similarity between the word occurrences relies on the context, so it can be different depending on how you define the context (how large is the window I’m looking at? Do I exclude any kind of words?); different context definitions lead to different plots. Once you have code that runs, you identify which parts of the code are stable and which parts may change in different runs. In this case, I will only change the dataset: that will be my argument. It is only now that I write the function template around my already-tested code:
myFunction <- function(mydf) {
    myvalues <- c(mydf$model.x, mydf$model.y)
    myrange <- c(min(myvalues), max(myvalues))
    mydf %>% ggplot() +
      geom_point(aes(x = model.x, y = model.y,
                     color = sense), size = 3) +
      xlim(myrange) + ylim(myrange) +
      theme_void() +
      coord_fixed() +
      ggsci::scale_color_d3()
}
Note that now mydf, inside the function, does not refer to my specific dataframe, but to whatever input is given to the function. This can be confusing, but at the same time, if you decide to name your argument df instead, you will need to replace all your references of mydf inside the function with df. I don’t always do that correctly, so I prefer to use the same name in the test and in the function definition.
The next step is to check whether the output is the same as before wrapping it as a function:
myFunction(mydf)
It is! Now, what about this other compatible data?
myFunction(mydf2)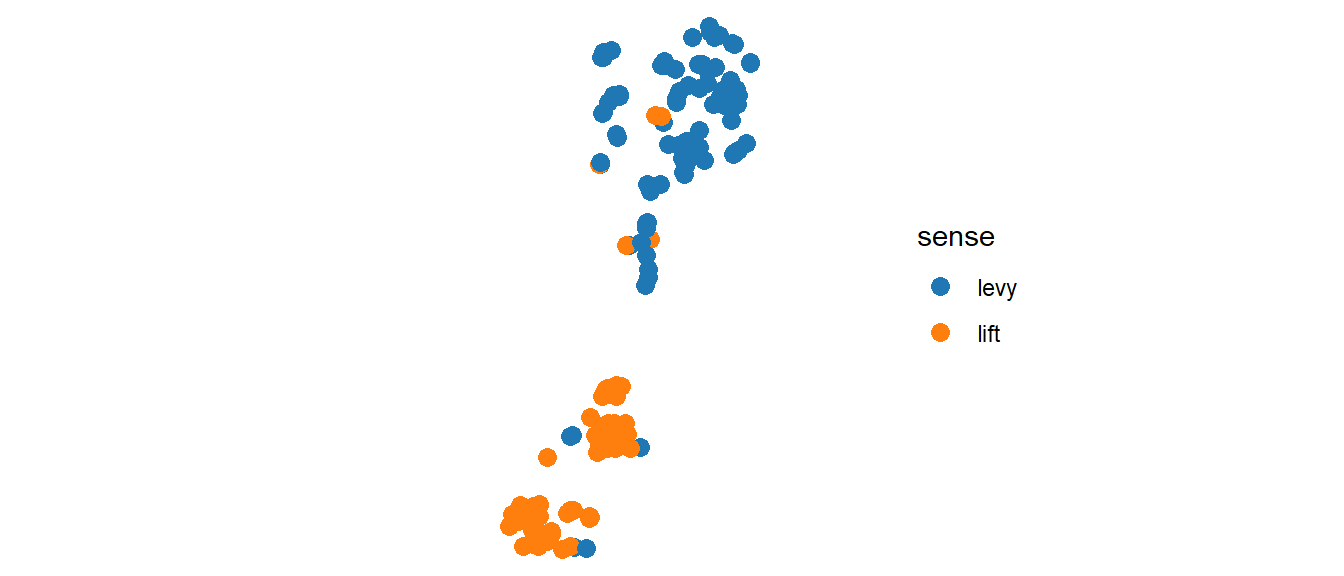
In practice, you should know what to expect when you change the dataset, e.g. actually running the code outside the function with the new dataset once.
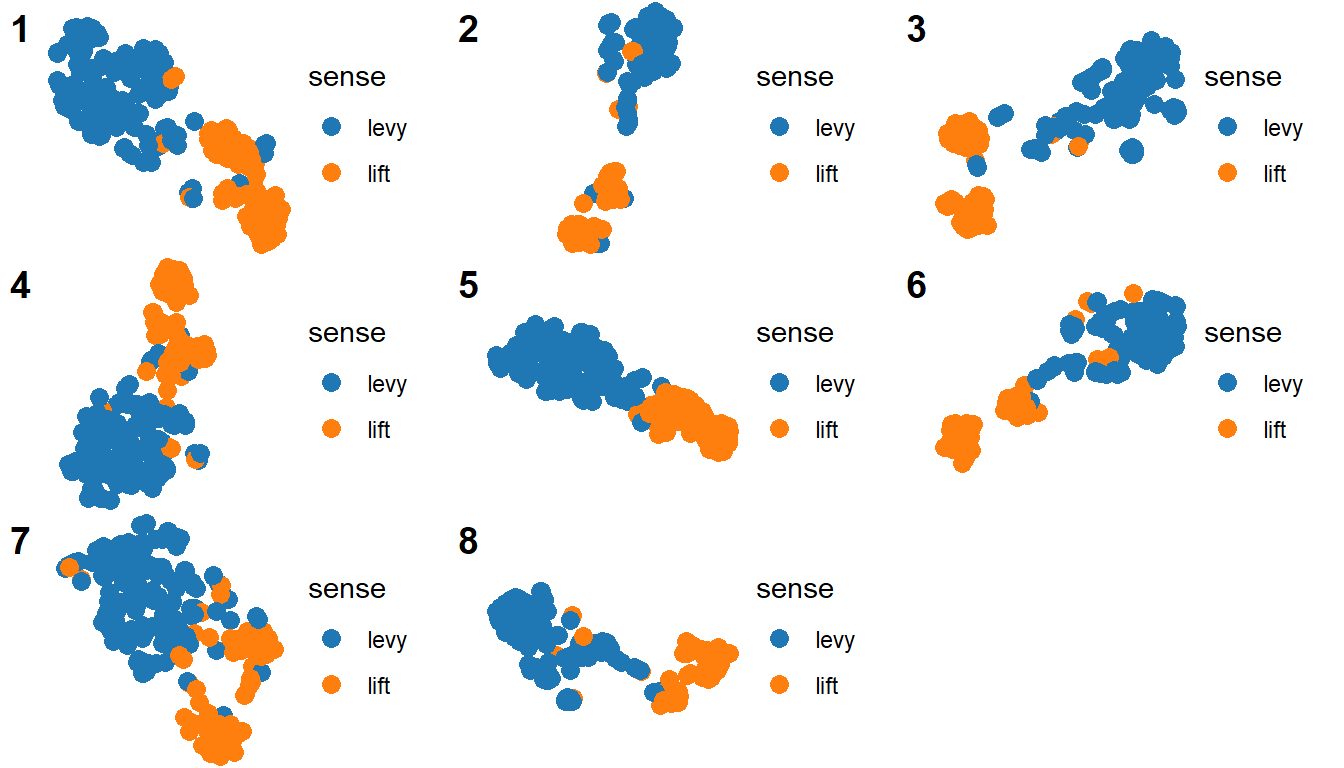
Now we have a function! We can call it as many times as we want, and it will always work the same way. You can see an example here, where I use a similar function to create equivalent plots based on data from different words. Another useful application in my case is plotting the different representations of heffen in one large grid. One solution would be to merge all my small dataframes into one, with the name of the model as a variable, and use facets with free scales (but at the same time fix coordinates?).
My preferred solution is with cowplot::plot_grid(), which can either take multiple plots or a list of plots as argument. A quick way of getting such a list is with purrr::map(), applied to my list of dataframes heffenModels (mydf was heffenModels[[1]] and mydf2, heffenModels[[2]]). The first argument of purrr::map() is a list or vector, and the second is the function that you want to apply to each of its elements.
myPlots <- map(heffenModels, myFunction) # list of plots!

cowplot::plot_grid(
  plotlist = myPlots,
  labels = as.character(seq_along(myPlots))
  )
Now I realize that the legend takes to much space in this format, so I want to remove it.3 I would also like the size of the dots to be smaller. If I had been copy-pasting the code for every plot, I would have to go and adapt the code in every instance! With a single function, I can take care of it much more easily. However, I don’t want the change to apply to standalone plots as well. A solution is to define optional arguments: by default, the legend will be at the bottom and the points will have size 3, but I can change the values on call. The default values are defined with the other formals of the function, and their names are used where the values would’ve been in the body.
myFunction <- function(mydf, legend_position = 'bottom', point_size = 3) {
    myvalues <- c(mydf$model.x, mydf$model.y)
    myrange <- c(min(myvalues), max(myvalues))
    mydf %>% ggplot() +
      geom_point(aes(x = model.x, y = model.y,
                     color = sense),
     # replace fixed size with variable point_size
                 size = point_size) +
      xlim(myrange) + ylim(myrange)+
      theme_void() +
      coord_fixed() +
      ggsci::scale_color_d3() +
      # add legend.position and establish value with legend_position argument
    theme(legend.position = legend_position)
}
Now I can re-generate my plots without legends and smaller point size:
myPlots <- map(
  heffenModels,
  myFunction,
  legend_position = 'none',
  point_size = 1
  )

cowplot::plot_grid(
  plotlist = myPlots,
  labels = as.character(seq_along(myPlots))
  )
It can be very liberating to realize that you can write functions too: that you can recognize the need and do something about it. That they are not magical objects that just exist already but someone thought them and wrote them, and you can too. You have the right, and if you have the need, you have the power!
Evolving with functions in R Markdown
My R code grew a lot as I learned to use R Markdown, because I could use all I knew of R to represent my ideas in my reports. Any kind of experimental analysis, table representation or visualization I could come up with, I could integrate in my report, with explanations, code and output merged together. Because I wrote several similar reports and in each report I went through the analysis of many different words (I had 32 words to analyze), there was a lot of repetitive code. And so it started.
- First, there was copy-paste
- Every time I wrote a snippet of code that could be applied to something else, I copied and pasted it multiple times.
- Second, there were functions
- Modifying all those snippets was tedious, so I created functions at the top of the R Markdown file and called them when I needed them.
- Third, there were scripts
- The chunk(s) with code at the beginning of my R Markdown grew so long that I had to scroll down too much to get to my actual text.
- (Yes, you can just collapse it too…)
- It felt much cleaner to move the functions to a different script and call it from the R Markdown. This also facilitated reusing that code in a different R Markdown.
You can call a script at the beginning of your R Markdown with the following chunk:
```{r, include=FALSE, code=readLines('path/to/my/script.R')}```- Fourth, there was the R package
- (Seriously, not as hard as you would think. Try it out following this chapter and keep the book as reference.)
- I had too many scripts, calling each other, with names that were not transparent any more (because I can’t seem to find a proper system). I had to follow long paths of scripts and functions calling other scripts and functions if I wanted to (1) understand what a function was doing, (2) correct/debug it or (3) adapt it to a broader usage. I would modify a function and that would render another function invalid: my old scripts and notebooks were not reliable any more. Assuming I found them.
At first, I was reluctant to create an R package because my functions were only useful to me, and it seemed as unachievable and overkill as writing functions had once seemed. But you can create an R package just for your private consumption, and then decide whether, how and with whom you share it. Why would you do this?
- your functions will always be available from wherever you attach it (
library(mypackage)); - you can easily check that your functions are complete, not dependent on global variables, and compatible with each other! You can even write tests and run them automatically!
- you always know where your functions are: you open the R package as a project in R studio and type the name in the search box;
- it encourages documentation: you can write it with help of
roxygen2and then look it up with?myFunction(it will feel super pro). Think of your future self! Besides, more than once I’ve realized that my function was too complicated or had redundant information thanks to writing the documentation.
Bonus tips
A thing with tips and “best practices” is that it’s really hard to apply them all at once at the beginning, and it’s also really hard to distinguish the most important ones (those that prevent bad habits) from the extras. However, I do find it useful to keep them aside, stored in a mental archive, not putting pressure on myself yet but waiting for the time when I’m ready. If I read the same tip many times, it might become more important. I think what happens most often, though, is that I reach a stage where I need to move forward —I suddenly need to create functions, to create a package, or something— because the previous stage is unsustainable, and then I can go to my backlog of tips for answers. That is when they stick.
So, here is a small contribution to your dusty box of seemingly irrelevant tips:
- Always make small changes at a time and test. I myself struggle with this: sometimes a change I want to make has chain effects that require a lot of manipulation before the code can be tested. It takes practice, but it’s good to write code that avoids those messes.
- Instead of making functions that call other functions which call other functions (in a Russian dolls-style), aim for functions that have an output that is worked on by the next function. This makes it easier to pull apart and debug, and more flexible if you want to use only a part of your workflow.
- The most important thing is that your code works: that it does what you want it to do. Elegance, efficiency, clarity… you may aim for them, but it’s a process, it’s a long path.
- Be forgiving of your messiness, it’s the best way to learn 😊.
For a technical, professional explanation check out this Functions chapter.↩︎
Note that these are different kinds of criteria. Setting the fixed axes is a matter of accuracy of the visualization (the shape actually changes!); removing the labels and values excludes irrelevant and potentially confounding data; making the plot square is just an aesthetic preference. Adjusting the colours tends to mix aesthetic preferences, accessibility (e.g. using a colour-blind-friendly palette) and good communication (can the colours be properly distinguished?).↩︎
I could also use
cowplot::get_legend()to retrieve it and show it only once, but I won’t get into that here.↩︎
Mariana Montes
Doctor in Linguistics
My research interests include cognitive and corpus semantics and visual analytics.